

You are ready to buy into an index fund and invest your hard earned cash! You log onto the website and you are all good to go but then you start to look at the different terms. You open it up and it is filled with jargon and indecipherable charts! What is NAV? OCF? Risk rating? Portfolio data? How do you make sense of all this!??
You panic, close the laptop and go back to watching Netflix! When Katie and I started to look at the Vanguard site to choose which fund we had several false starts and were nearly put off investing! Open up the Vanguard site and let’s go through it line by line together…… (This is the UK site but most of the terms are the same globally.)
Where to find the information…..
There is a separate page on the Vanguard website for every single fund that Vanguard sells. This is how they give you all the information you need to know before investing. Step 1 is to visit the Vanguard site and find the fund you want to invest in.
The last article that Katie and I published is all about choosing which index fund to invest in. Make sure you have read that article first and then come back to this one!
In this article we will be taking you through the page for the FTSE Global All Cap Index Fund. If you want to follow along click on the link and let’s get going.
Even the name is confusing?
When I first looked on the Vanguard website even the names of the funds seemed like a foreign language to me! FTSE? What is that? All cap? Let’s start with the name of the fund and then get into the page details.
FTSE – This stands for Financial Times Stock Exchange. The FTSE (pronounced footsie! I know!) Group manage and own around 250,000 stock market indices around the world.
Global – this means the fund is a global fund and includes stocks and shares from around the world. The US index includes only companies from the USA and the Developed world just has companies from the developed world! We’ve got an article coming up soon looking at the differences between the Developed world fund and the Global fund.
All Cap – Cap stands for market capitalisation. Market capitalisation is a way of showing how valuable a company is. You take the number of shares and you multiply it by the share price to show the market capitalisation or total market value of the company. Small cap, medium cap and large cap refer to the size of the companies. So All Cap tells you that this index fund includes companies of all sizes not just the giant ones!
Index Fund – An index fund is a list of companies pulled together in an index! For a full explanation of an index fund read this article.
Can you believe there is so much information in just the title of the fund? It is no wonder people think that investing is complex and they shy away from it! You have to learn a whole new language to get going.
Stick with me. We are going to slowly break down all the terms and help you get comfortable understanding all of this. My aim is that after you have read the Index fund Series of articles you will be comfortable choosing a fund and investing your own hard earned dollars or pounds into one!
Let’s help you get comfortable buying back your freedom!
Disclaimer: This article is not financial advice. Katie and I are just sharing our opinions and ideas. We are not trained advisors or financially regulated. Read our full disclaimer here.
The Index fund page itself
Katie and I have created a video talking through all these different bits on the website. We thought that would make it come to life for you! I have obviously written you a guide too. If you are able to, start with the video and then read on below.
The key terms defined
When you first click on the fund page you are shown four boxes at the top of the page with different numbers! Let’s have a look at what these numbers mean and the range between them.

NAV Share price
This is the cost of one share of the fund. Don’t be put off by how high or low this is, sometimes the single share value can be hundreds of pounds if not thousands. You can buy fractions of a share so you don’t really need to worry about this too much. NAV stands for net asset value. The way they work out the net asset value is to take the total value of any cash and assets in a fund, take away the liabilities (how much money they owe) and then divide by the number of shares.
For example if you had £10m value of stocks and shares and there was 1m shares then each share or NAV would be £10.
This particular number is irrelevant for Katie and I because we choose what fund we want and how much we want to invest. The number of shares of the fund it buys doesn’t matter to us. We’re more interested in how much we have invested than how many shares of the fund we happen to own. You can buy partial shares in these index funds. Say you have £1,000 to invest and the NAV price is £211.46, then your money will get you 1,000/211.46 = 4.7290 shares in the fund.

Number of Stocks
This is something Katie and I do look at. This is the total number of companies you are going to be invested in which means the higher the number the more diversely your money is invested. What is Diversification? Read this article.
The famous fund that JL Collins, author of The Simple Path to Wealth, recommends has 3950 companies of all sizes across America. Katie and I are invested in the Developed World ex UK fund which has 1987 stocks and the one we are looking at in this article has 7180 stocks.
The higher the number the more companies you are invested in. The lower the number the more concentrated your money will be across those companies.

Ongoing Charge
This is the cost of owning the fund, the percentage charge that will be taken from your investments each year. The higher the value the more money it costs to own the fund. This fund has a 0.23% charge so if you have £10,000 invested you will be charged £23 a year.
This doesn’t seem a lot but fees compounded over years can really eat away at your investments so you are looking to have the lowest possible fees. Katie and I wrote an article to compare and analyse the fees between the FTSE Global All Cap Index Fund (0.23%) and the Developed World ex UK (0.14%) to see how much difference it makes over a life time! The clash of the Titans can be found here.

Risk
This is a scale of how risky (volatile) the investment is with 1 being very low and 7 being very high. It is measured on a scale of 1-7 on the synthetic risk and reward indicator (SRRI). I know what you are thinking: “what the h*!# does that mean?”
It is a scale that looks at how volatile the investment is (how much the price of the asset goes up and down and how fast). If it is a high number then there are likely to be lots of up and down movements in the price. If there is a low number it means the price is more stable.
The stock market in general is a very volatile place with prices going up and down a lot! So most of the stocks and shares have high risk ratings. This particular rating doesn’t say which way the risk is going, it just tells you that it moves a lot! They don’t distinguish between up or down.
This rating also doesn’t tell us the long term likelihood that your investments will go up. It just measures the movement up and down of the price; aka volatility.
A rating of 5 means that the price can move as much as 10-15% up or down in a week. This doesn’t really affect us if we are investing over the long term (decades plus).
Fund Objectives explained
This gives you a little bit of information about the fund itself and what it is set up to do. Most index funds are created to mirror a market index and this particular one is set to mirror the FTSE Global All Cap Index. There is a short paragraph on the website that sets out the objectives for the fund.
The key information here is:
- It is a passive fund as opposed to an active fund. In active funds you have a fund manager that buys and sells assets and trades in and out of the market. A passive fund mirrors the market and only buys and sells assets in order to match what is going on in the market.
- It tells you that they invest in all sizes of publicly traded companies around the world including the emerging markets (India, China, etc.)
- The fund works to remain fully invested and does not hold cash. This means that as soon as they get your money they buy more stocks and shares with it and don’t hold onto cash to try and time the market.
The other pages

After the overview page there are 4 other pages for you to read about each fund. Here’s our thoughts on the pages and what to look out for:
Price and Performances
This sets out the current price of the fund (i.e. how much a share is worth; don’t pay too much attention as you can buy a fraction of a share). It also gives you three different charts and graphs that show previous performance of the fund. The price analysis shows the price of the fund over time. Ideally this should go up over the long term! The past performance chart gives you the percentage gain the fund has made on either a rolling year, quarterly or calendar year over time. Then finally the past performance chart shows what would have happened to your money over time if you had invested £10,000 into the fund.
One warning that Katie and I have is that past performance is no indicator of future performance. i.e. just because something has gone up in the past doesn’t mean it will in the future!
Our entire index investment strategy is based on the belief that the market always goes up IF you have a long enough time horizon. This is based on the strategy of buying the funds and NEVER selling. For a better description of this theory than I could ever write, read JL Collins Blog “The Market Always goes Up!”
Portfolio data
This is the page that shows you what is actually in your fund and is the one that Katie scours to find the data for her amazing charts! There is a lot of technical information on this page.
Characteristics shows you the key facts about the fund such as how many shares are owned with in it, its return and then compares it to the benchmark fund (in this case the FTSE Global All Cap).
Bringing the Portfolio data to life
Katie has scraped the fund data from the Vanguard Websites and created an incredible selection of charts for you so that you can visualise this. To bring the above information to life here are a few of her graphs. These work best on a big screen so break out the laptop or tablet. They are interactive as well so you can zoom in and out and roll over different parts to see the exact figures.
Region Split
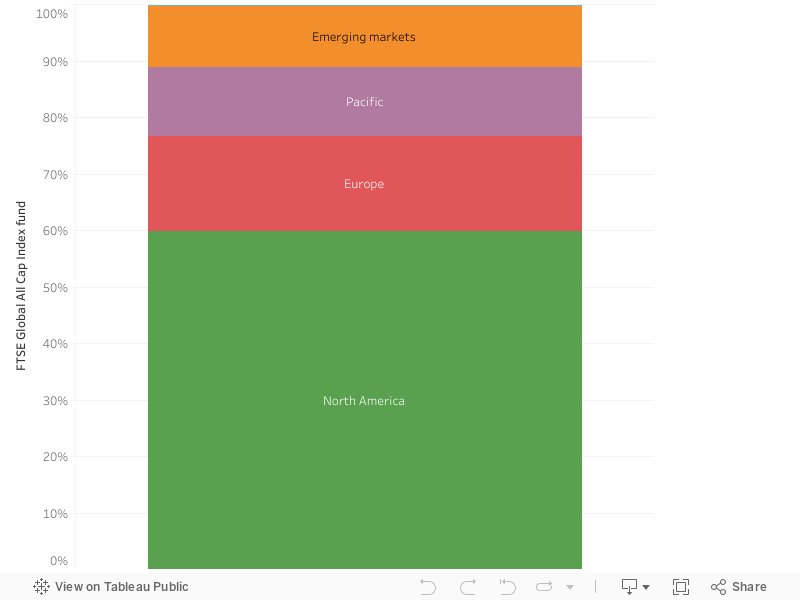
Region exposure. This shows you what percentage of your money is in Europe, North America or Emerging Markets etc. Katie has visualised this as a bar chart so you can see the percentage invested in each different region!
Market Split
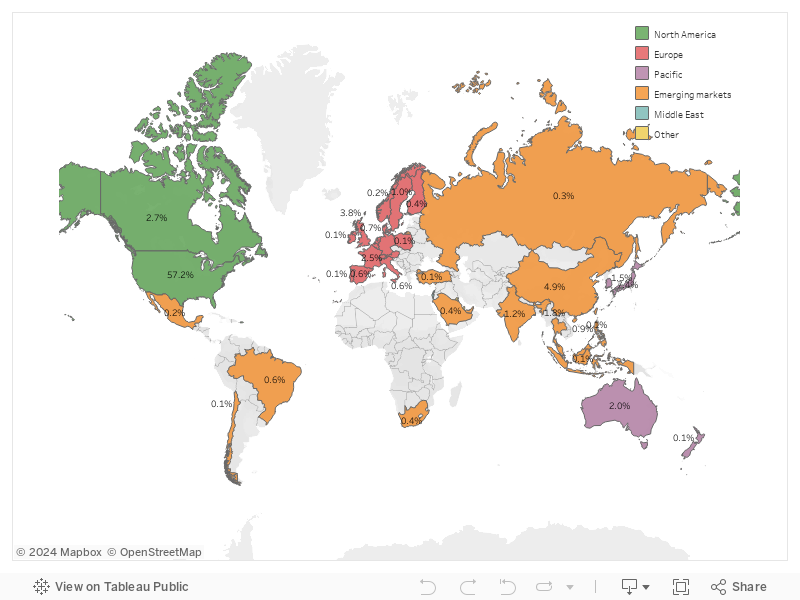
This shows you which countries you are invested in. Katie has pulled this data together and visualised it as a map of the world and where your money would be invested if you bought and by what percentage.
£100 invested would get you £57.20 of USA stocks, £3.80 worth of UK stocks and £4.90 invested in China!
Sector Split
This shows you which sector (technology, health, financial etc.) you are invested in.
This next chart Katie has created is incredible. it shows you every company in the Global Fund and split by sector so you can easily see which sectors dominate!
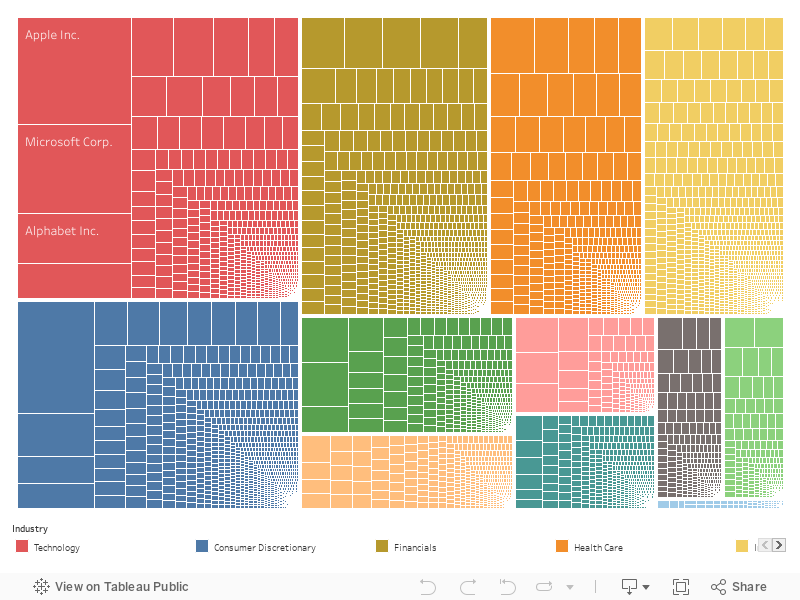
You can see clearly in the top left that Technology is the largest sector in the fund and in the top left box you can see that the largest stock in that sector is Apple making up 3.25% of the fund in total.
I love the way Katie has laid this out. If you want to really understand what you are investing in when buying one of these funds spend a few minutes rolling over each of the boxes and seeing the companies, sectors and countries.
The beauty of index funds is that as different sectors become more or less dominant in the market, the index fund automatically reflects that. You don’t have to choose which sectors you think will be successful, you just buy some of everything.
Distributions
This page shows you the yearly distributions or dividends that you will get from the fund. This number changes every year so tells you what you have got to date.
it is also important to remember that this particular fund is an accumulation fund and as such you won’t se these distributions (dividends) as they are auto re-invested to by more stocks. This is fabulous when you are still investing as it means your stocks grow and compound faster.
Costs and Minimums
This page shows you the cost of owning the fund. The FTSE Global All Cap Index Fund Ongoing Charge Figure is 0.23%. This means that no matter which way the fund goes, whether you make money or not, Vanguard will collect their fee of 0.23% of the value for managing the fund.
Some funds have lower OCFs and some higher. Katie and I are planning on an article to show you the difference these fees make over a life time of investing. It will be the next article in this series… coming soon!
And that is nearly everything you need to know about the different information that Vanguard gives you on its website. You should now be equipped to click around the site and get comfortable reading the pages.
I am sure as you click around the pages you will have questions and thoughts and Katie and I want to know them! Please write your questions in the comments below and we will update and improve this article for you as we go!
When index investing goes wrong
Quick work of warning about index investing. Our strategy for index investing is a buy and hold forever strategy.
This stuff can go wrong very quickly if you panic and sell in a downturn. For example in 2020 we had Coronavirus Crash which was the fastest fall of global market in stock market history!
If you had owned The FTSE Global All Cap Fund your investments would have fallen by 26% in under a month!
To put this another way if you had £1,000,000 invested it would have crashed to £740,000 and you would have lost (on paper; important distinction!) £260,000.
Could you stomach seeing your money evaporate? Katie and I lost £184,000 on paper in that period.
Did we panic and sell?
The way you lose big time is if you panic and sell during this period. Katie and I looked at each and smiled that we had lost so much and just said let’s wait for it to bounce back. The market always comes back.
We had only lost that money on paper. We still owned the same number of shares. If we sold at that point then we would have locked in the losses and we would have actually lost that money.
A similar analogy is the home you live in. If the market crashes and your house is now worth £50,000 less then on paper you have lost that money. In reality you still own the same number of houses! And you can still live in it.
The only way it becomes a problem is if you re forced to sell when the market is down!
Katie and I buy stocks and shares and we hold for the long term (the rest of our lives!). We know there will be volatility and up and down movements. We also know that over the long run the market always goes up so if we ignore the up and down movements, don’t panic, and ride out the waves, we are going to be fine!
Why are we talking about index funds?
The reason Katie and I are talking index funds is they are the investment vehicle that we have used to be able to retire early. We invested our spare money into index funds which grew and compounded over the years to get to an amount that we never have to work again if we don’t want to.
I was 40 when we hit this number and was able to “retire” 25 years earlier than your average British person! Obviously I am not completely retired as we spend loads of our time creating articles like this one. The difference is that I have done this because I want to help other people and I am not getting paid to do it.
If you want to know the simple maths behind working out how much money you need to retire read this article.
The Ultimate Guide to Investing
Katie and I have created the ultimate guide to investing to help you through any questions and concerns you may have about investing. We created the guide in response to our Rebel Finance School course which is designed to help you take control of your finances and start to make progress towards Financial Independence!
We want to help you take control of your finances, start to build financial security and look after yourself and your family.
Good luck with your investing and if you have any questions then please stick them below.
It’s really a nice and useful piece of information. I
am satisfied that you simply shared this helpful information with us.
Please stay us informed like this. Thanks for
sharing.
THanks for commenting
Hi Alan and Katie, Im living ijn NZ and just beginning to invest and keep my head above water with all the information there is to digest. I really enjoy your content and find it so user freindly and less daunting ( I heard you on the happy saver podcast) My question is that I have a sharsies account ( investing app) which I am trying to fidn the vanguarde ftse global fund on but I cant seem to find it. Should I go directly to vanguard website to invest. I find the sharsies platform nice and easy to work with but it is possibly limited in its options of funds?
Brid, thank you o much for the comment. Sorry for the slow reply. We wee away at Econome conference! Invest Now have the foundation series and they seem to be an amazing option in NZ. Have you come accross them? Alan
Thank you for all your really helpful information, Alan and Katie. It is much appreciated.
Following your advice, I have decided to invest in the Vanguard FTSE Global all cap index fund. However, I think I have made a mistake as it is a general account. Do I need to invest in this fund as a SIPP to avail of the obvious tax benefits?
Many thanks in advance and keep up the great work!
Hey John that is awesome, Congratulations. Yes SIPP is the most tax efficient account, ISA second and GIA is the worst tax efficiency. Have you been on the course we do? Week 8 explains all account types….
Thanks info the info,
I chose FTSE Global All Cap Index Fund (VAFTGAG) instead of 0.23% of £10,000 but actually I need to pay
Account Fees £48.00 (0.77%)
Fund Management Costs £19.83 (0.27%)
Anual fee of £67.83
Is anything wrong with it?
Hey Venceles, so this is for you opening a Vanguard SIPP? is that correct?
The FTSE Global All cap is a fund we talk about a LOT on the course and is a great fund. Yes you would pay 0.15% platform fee, then the fund fee . Where did you get the 0.27% from on the fund management fee? Alan
Thanks Alan! it is S&S ISA, I just confirmed with them that the annual fee £48 (£4 monthly) + 0.23%. So if I invested £1000, I have to pay roughtly £48 + £11.5 = £59.5 annually. Isn’t more expensive than expected?
Hi Alan and Katie,
Thanks for the article and video – very helpful!
Just a question about the Costs & Minimums section: what is the £500 one-time payment? I take it this is a £500 lump investment and not a £500 fee/charge?
Also, what happens if your circumstances change and you have to pause your £100 minimum monthly investments? Are you forced to sell? Or can you leave your money invested until you can resume?
Thanks,
Callum
Hi,
Thank you so much for all this, and the course, I’m loving it!
I’m hoping to set up a few accounts – a LISA, 2 junior stocks and shares ISAs for my kids plus a stocks&shares ISA for anything leftover within the gap I can create (though maybe quite clunky to have 4 accounts!) – waiting for final decision after week 8 on Monday!
My question is, after my initial lump sum, I’m likely to pay into the accounts each month. For ease I may rotate each month until I max out the tax free totals for each account. I’m confused as to weather there is a significant minimum charge for every single investment or whether this is just a % – in which case it presumably doesn’t make a different how much I’m investing and I should just stick any extras into an index fund each month to get it in asap.
Is is usual to keep funds to 1 fund?
Next to work out which fund to invest in…..
Hi Katie, its your ex “Kili tent mate” hehe. I was watching your videos to invest in “index funds” and agree it should be the way to go for my “savings”. The issue is I’m not an UK resident (still living in Argentina)… so I discovered I cannot invest by “vanguard” as you suggest. Do you have any advise/ idea about investing options for “non UK residents? Gracias!!!!
Josefina
Hola amiga de la carpa del Kili! 😄 We must chat soon! Alan has created the response below with a little help from AI.
Let’s break down your options for investing in something like the VT Fund from Argentina. This is based on our research—trust nothing, double verify everything before investing!
🇺🇸 Option 1: U.S.-Domiciled ETFs (like VT)
You can access VT (Vanguard Total World Stock ETF) through brokers in Argentina using CEDEARs or direct U.S. market access. Two popular platforms:
✅ InvertirOnline (IOL)
Offers CEDEARs and direct access to U.S. ETFs.
No account opening or maintenance fees 1.
Commissions vary but are competitive.
You can invest in VT and other global ETFs in pesos or dollars.
✅ Bull Market Brokers
Also offers CEDEARs and direct access to U.S. ETFs.
No account opening or maintenance fees 2.
Trading commissions range from 0.50% to 0.10%, depending on your monthly volume.
Dividend handling incurs a 1% fee on the amount received.
🇮🇪 Option 2: Ireland-Domiciled ETFs
If you’re looking to reduce tax drag, Ireland-domiciled ETFs are a powerful alternative:
15% withholding tax on U.S. dividends (vs. 30% for U.S.-domiciled ETFs) 3.
No U.S. estate tax risk, which is a big deal for non-U.S. residents.
Often available via platforms like Interactive Brokers, which many Argentinians use to access European exchanges like the London Stock Exchange.
Popular Ireland-domiciled equivalents to VT include:
VWRA – Vanguard FTSE All-World UCITS ETF (Accumulating)
CSPX – iShares Core S&P 500 UCITS ETF
These ETFs are designed for long-term growth and tax efficiency.
🧭 Final Thoughts
You’ve got options! Whether you go with CEDEARs, direct U.S. ETFs, or Ireland-domiciled funds, the key is to:
Understand the fees and tax implications.
Choose a platform that suits your needs.
Separate your goals (retirement vs. short-term savings).
And always double check everything before investing.
You’re on the right path, Josefina. Keep learning, keep questioning, and keep building that Freedom Fund!
Love that you wrote here. Does this give you enough to get started? Can you tell us what you find out? We have just been figuring out the Brazilian market whilst we are staying here too!
A&K
Peace and Pineapples 🍍✌️
Hi Alan & Katie,
I’ve been watching your training in the last couple of weeks and decided to invest in the FTSE Global All Cap Index fund by moving my Cash ISA directly to Vanguard.
I was shocked to discover that in the Cost & Charges document, which I agreed to just before clicking transfer, Vanguard also add 0.8% transactional fees every year.
“Transaction costs – these are costs incurred by the managers when buying or selling underlying
investments”
Were you aware of this? So instead of 0.23% the fee is 0.31%.
They mention them in their literature, but they never include how much or demonstrate them in their costs and fees, until you have to sign on the dotted line.
I spoke to Vanguard on the phone, and they said that the transactional fees change, so they can’t put them on the website.
This is not at all “being transparent”. They do have an idea at least of a range of these transactional fees but still completely exclude them from their scenarios of possible charges.
In your experience, do other companies also do that?
Hey Mira, other companies do exactly the same if not worse. I think we need to mention that on the course next year. Thank you for pointing that out. The % they are showing you is of your investments so in reality would be a lot lower and it is the buying and selling costs as the fund rebalances and as your dividends get reinvested. Some years it is lower as there isn’t as much going on. We pay exactly the same as you. We didn’t actually know were paying this until we used Vanguard even though we owned the fund elsewhere as the other providers don’t even tell you about them! It is annoying but part of investing. Alan
Thank you for sharing your experience, Alan. Yes, it would be helpful to include the transaction fees, too. I noticed that some Vanguard funds/ETFs have lower estimated transaction fees, so these add up and increase the difference, not taking into account the performance.
Hey Mira, got it, I think we do need to cover that more in what we are doing. Good point. I will figure out how to build it all in for the future. THANK YOU.
Hi Alan and Katie, reading through the notes, section under “ongoing charge” the link to compare the 2 index funds, takes you to the homepage, not the article in question
Thanks Rod, I will update. Thank you
Thanks for providing such an easy to follow guidance. I’m slowly getting my children to understand investing by using your school. Best site on Facebook, or am i obsessed as my wife calls me.
Rod, you are amazing and nice work geting the kids on board. Starting early is so powerful! thanks for commenting and writing to us! Sending you happiness! Alan