

You’ve decided that you want to start to invest. Yay! You are on your way to financial independence! You have decided Vanguard index funds are the way forward. Super! You log on to their website ready to invest and you see the HUGE selection of funds available to you! Which one do you buy? Where do you start? What does it all mean?
So many of the people on our courses get to this stage and then this final step of choosing a fund stops them from getting going. We want to help you get over this last hurdle and get started investing!
For an overview of which Index Fund to choose, start here.
This article will help you choose between two Vanguard index funds – Developed World Ex-UK and FTSE Global All-Cap – and what the differences between them are!
We’re going to break down the differences between the two funds and, given that nearly all of our money is invested in the Developed World ex-UK fund, whether we are going to change that going forward.
We don’t receive sponsorship from Vanguard or anything in return for promoting their products. I kind of wish we did, lol.
Where are you investing?
Prefer to watch a video?
We have made a video for you explaining the differences and similarities between the two funds. Check it out on the right and/or continue reading!
We have spoken a lot about diversification (What is diversification) and how important it is when creating your investment portfolio. Between the Vanguard Developed World Fund ex-UK index fund and the Vanguard FTSE Global All Cap index fund, where will you invest your hard-earned savings?
Katie has been having too much fun (we should cut back) visualising the funds for you so we can truly understand where our money is going when we invest.
We are partly doing this work for us to work out if we have our money in the right place or if we should change our strategy. We didn’t really know what we were buying when we started to invest in this fund.
On that note, this article is “probably” analysis overkill. You could pick either one and be pretty damn happy you have made a good decision. That is what we did when we were first getting into index investing. JL Collins said to buy a low cost, broad-based index fund and we did, without knowing all the ins and outs that you are about to discover.
What we found, though, was that people on our Rebel Finance Course really struggled when choosing funds, and it normally came down to these two. We have also written a guide to ESG (ethical, sustainable and governance funds) funds to help you decide which fund is right for you.
The purpose of this article is to break down the two funds and help you choose so you can get started on your journey towards financial independence. You might get a deeper understanding of investments and index funds along the way too!
Where’s your money going?
Let’s start with geography. This map shows you which countries you are investing in by weighting. What that means is what percentage of your money is invested in each country!
The first map shows the FTSE Developed World ex-UK. You can see that as of 30 June 2023, 70% of money that you invested in the Developed World fund would go into US stocks or companies. 7.3% of your money is invested in Japanese stocks and shares and 0.2% in Israel. The different colours are different regions. Orange is North America, blue is Europe, and green is Pacific.
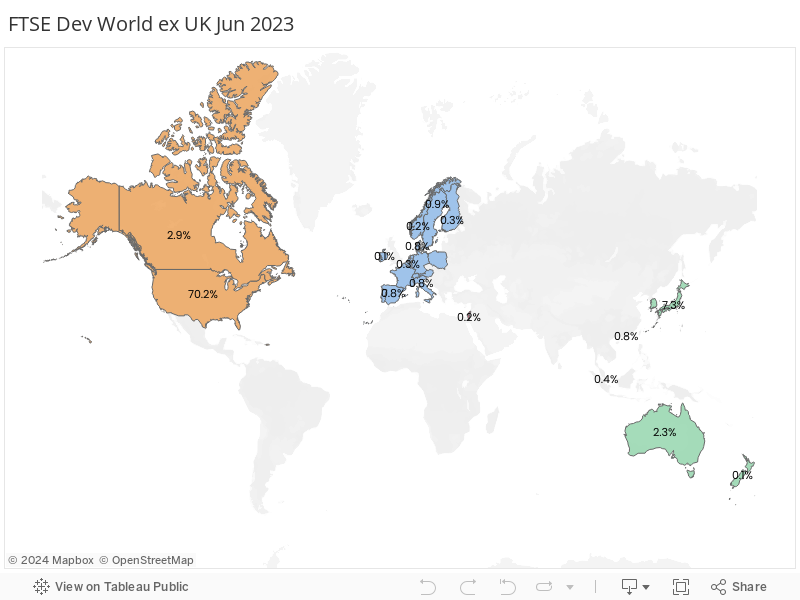
Katie has created an interactive map so you can scroll around the above map and zoom in and out to see the different countries! These work best on a large screen so you can see them and move about. As you roll over each element it will give you more details. Get out the big screen!
The second map here shows you the FTSE Global All Cap Index fund. These fund names are a bit of a mouthful so from now on, I will refer to the two funds as Dev World and Global.
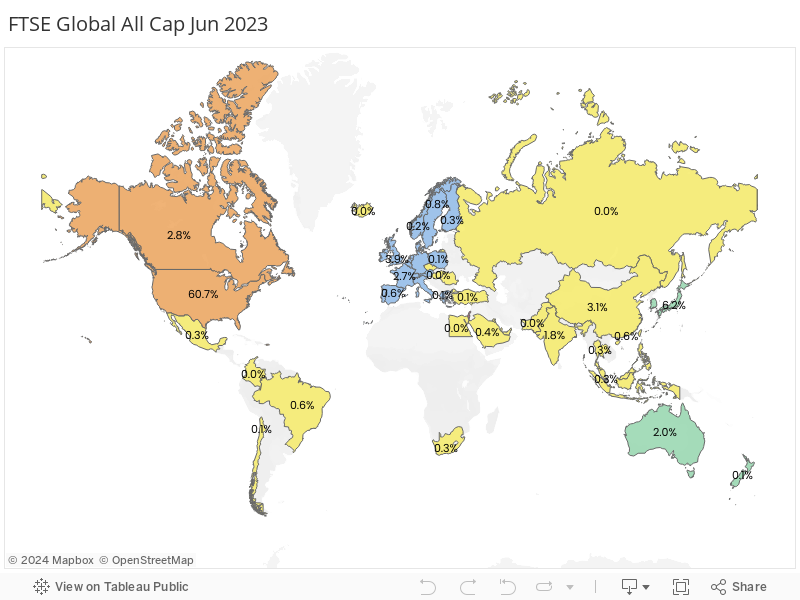
The main difference between the two charts is that the Global fund has investments in South America, parts of Africa, India, China and other Asian countries; the Dev World fund doesn’t hold any of these. The Dev World’s holdings are more concentrated in the USA with 10% more of your investments going into the USA.
Katie has put the two world maps next to each other so you can compare where your money is invested around the world:
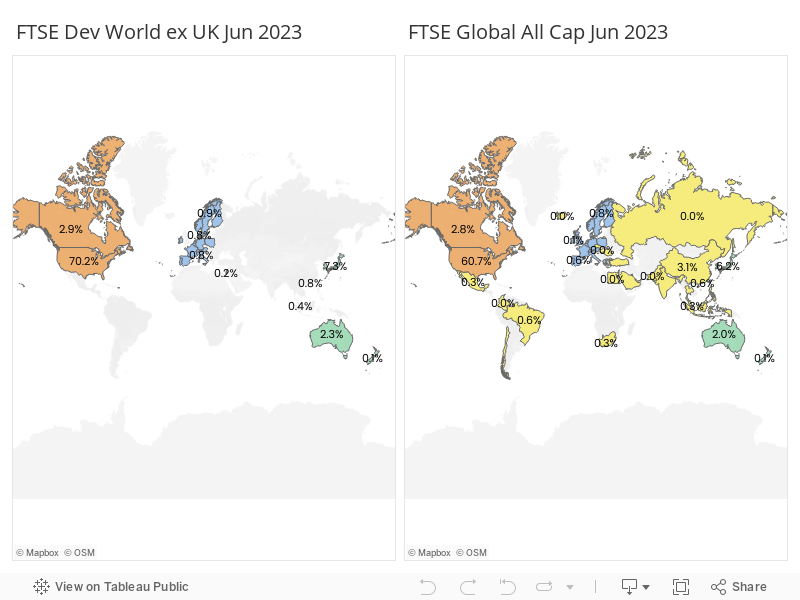
Region Comparison
There are so many different ways you can analyse the two funds. We are going to take you through them step-by-step.
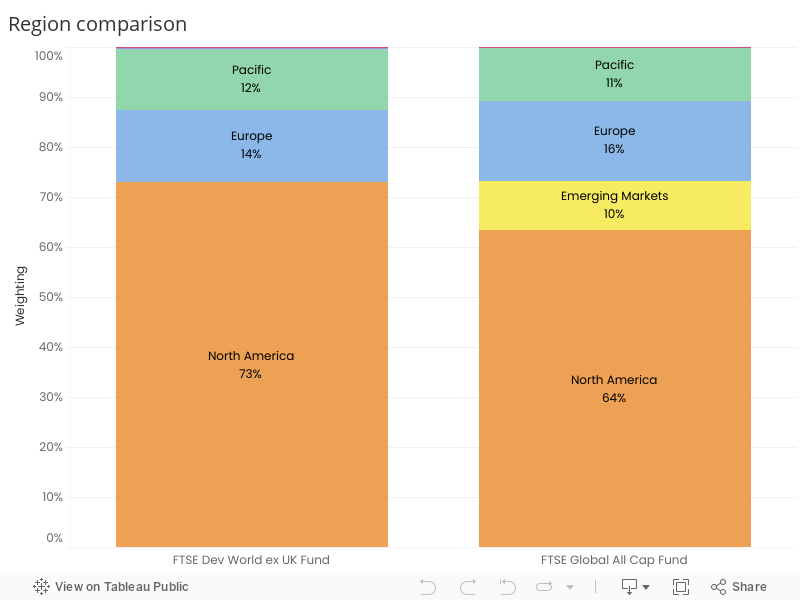
In the bar chart below, Katie has pulled this data together in a different way so you can see the difference between the two funds in terms of region. The only real difference is the addition of the emerging markets in the global fund. You get a slightly lower percentage of North America if you buy the global fund and you get emerging markets (China, India etc.) instead.
Sector Comparison
Next, let’s have a look at the industry sector comparison. An industry sector is a way of grouping a set of companies together that are in a similar line of business, such as finance, technology, or consumer products. The first thing I noticed when I looked at this chart was there was hardly any difference at all between the two funds.
Dev World is on the left and Global on the right. The addition of emerging markets into the global fund doesn’t really change the industry sector split at all.
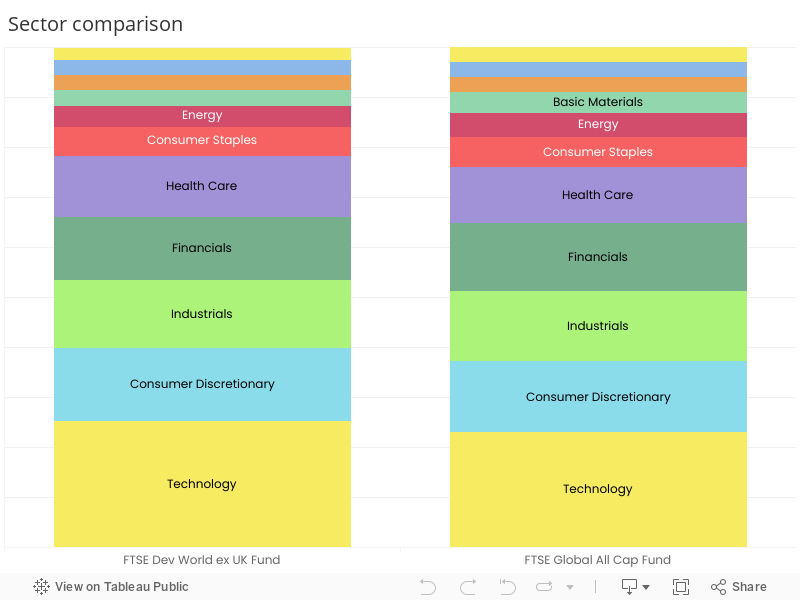
There are slightly more technology firms in Dev World due to the concentration of that type of firms in that area of the world.
Number of Companies
One of the BIGGEST differences between the two funds is the number of companies that you are invested in. Katie and I have spoken a lot about the power of diversification (What is Diversification?) and how useful it is.
In Dev World you are invested in 2,047 companies around the world, but in Global you are invested in 7,194 companies! That is a huge difference of 5,147 companies!
On first glance that means you should go for the most diversified fund doesn’t it? Just buy the one with more companies in it?
We were curious how much overlap there was between the two funds. How many of the 2,047 Dev World companies are also in Global? And what percentage of Global do these companies account for? The question is not just about the number of the companies but the weighting.
I can hear you asking, “What the hell is weighting, Alan?”
When Vanguard gets your money, they don’t invest it evenly in all the companies in the fund. They put a higher percentage of your money into the bigger companies to match the size they are in the market.
What this means is that more of your money gets invested into the bigger companies like Microsoft, Apple, and Google etc. They represent more of the market because they are the bigger, more valuable companies.
This is an important feature of the index and how your money is invested because the more valuable companies tend to be more profitable. You want more of your money in the bigger companies.
Katie woke up one day with the question in her head, “How much of our money is invested in Apple stock?” This led to her exploring all of this data and creating all these charts.
It turned out that quite a high percentage is invested in Apple. As of 30 June 2023, Apple accounted for 5.2% of Dev World (the fund we own). 4.1% of Global is made up of Apple shares.
The biggest companies in the fund are very dominant. The top 100 companies in Global make up 40% of the fund by weighting. That is a huge percentage given that if all companies had an equal weighting, 100 out of 7,194 companies is just 1.4%.
1.4% of companies in the global fund make up 40% of the value!
I particularly love these next two charts Katie created. They are interactive, so make sure you open them full screen so that you can roll over each of the bubbles to see what they actually are.
The blue represents the companies in both Dev World and Global, and the orange represents companies just in Global. These charts are a way of seeing the difference in the number of companies and then the weighting of those companies.
The chart on the left shows the difference in the number of companies between the two funds. This means that every bubble on the chart is the same size and each company has equal weighting. In this view you can see that Dev World is a relatively small portion of Global. What is really interesting to note is that pretty much all of Dev World is included in Global. When you buy Global you get everything in Dev World plus a load more companies from the emerging markets.
Then look at the chart on the right. It shows exactly the same company data but this time adjusted for weighting, so we can see how much of Global is actually made up by Dev World! The only change between the two charts is that in the chart on the right the size of the bubble represents how much of that stock you own in the index.
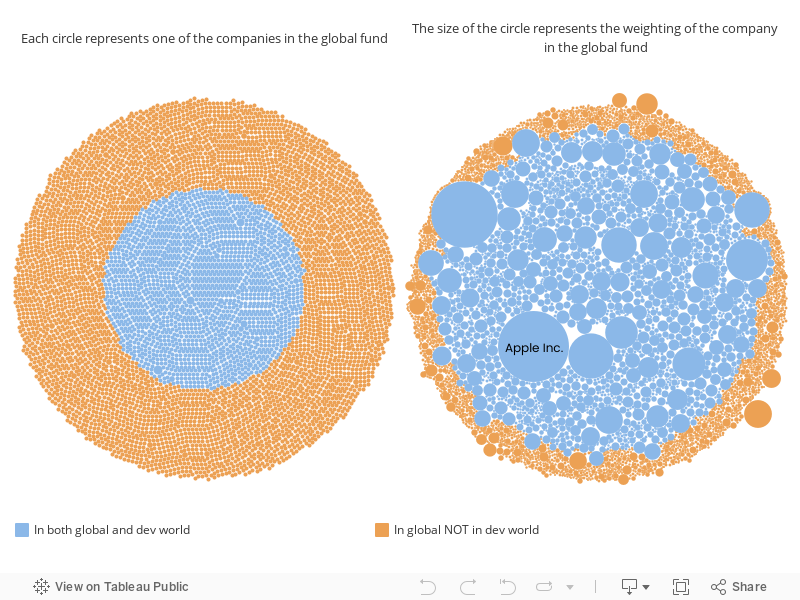
What we realised is that it sounds like you get a HUGE amount more when you buy Global as you are getting nearly 5,000 more companies. But actually the percentage of your money that gets invested in these “extra” companies is quite small.
As you can see from the chart on the right the blue (Dev World) makes up nearly all of the chart and the orange (additional shares you get with Global) is a small amount extra even though it is a large number of companies.
Dev World makes up 78% of Global! We would not have realised this if we had just read the top line stats on the website.
So far we have looked at geography (where your money is going to be invested), industry sectors, and the difference between the funds in number of companies and then by weighting.
Let’s discuss performance, profit, the good stuff!
Fund performance
Let’s get down to the nitty gritty. Profit. We are buying these index funds as an investment to make us wealthy over time so that we eventually no longer have to work and are financially free.
Which one is going to get us there faster? Which will perform better?
The simple answer is no one knows! NO ONE. Not ever Warren Buffet, the world’s greatest investor, knows and he will happily tell you that!
We can look at past performance for a clue but as every single investment advert will tell you: “Past performance is not an indicator of future performance.” What they mean is that just because a fund did well this year doesn’t mean it will do well again next year.
It was at this point that Katie and I had discussed doing an evaluation of our investments to see if we would have been better off if we had invested in Global instead of Dev World.
We decided against doing these calculations because we would not have done anything different knowing this and it will not change our actions going forward. Even if we work out that Global was better over the last five years, that doesn’t mean it will be over the next five! Doing this calculation would not have impacted our decision about what to do in the future.
It should also not impact your decision about which one to buy. Looking at the past performance in order to work out which fund we should invest in is irrelevant.
Just to put your heart at ease, let’s take a little look at the past performance of these two funds over the last five years and you’ll see that there is very little difference between the two funds. Firstly, Global.

Next, Dev World:

What you will notice is that they are very closely correlated. You can probably already guess why? Because they are broadly made up of the same things. Global is Dev World plus a bit of emerging markets. So of course they are going to be closely correlated.
Overall, Dev World has performed marginally (and I do mean a small margin) better. Does that mean it will continue to do so? No!
Do we have any idea which one will do best over the next decade? Three decades? No. We just have to pick one and go for it.
My only inkling is that as the world grows and changes over the coming years and decades, other countries will start to expand their economies and grow. I expect to see the rest of the world becoming a bigger piece of the global economy. This is an argument for investing in Global.
Impact of fees
Katie and I always stress the importance of fees. Shouldn’t you just be going for the cheaper fund?
Is it worth paying extra for Global?
The costs of these two funds are 0.14% (+0.01% transaction fees) for Dev World versus 0.23% (+0.05% transaction fees) for Global. This is a difference of 0.13% overall. Is that significant? Will it impact me over the long term? Should I just be going for the cheaper fund?
These are questions that Katie and I have asked ourselves when working out if our strategy is good and what the impact is over time. Obviously Katie got VERY excited and went off and created a spreadsheet to model the impact over our lifetime to see what difference it would make!
After an hour engrossed in a spreadsheet she took her hoodie down and shouted at me, “I have the answer!”
To put into perspective the impact of the difference in fees between the two funds we decided to include an actively managed fund in the analysis as a comparison.
Assumptions
- We assumed the same annual growth of 10% for all funds. This wouldn’t be true, but is the only way to isolate the fee impact. We also can’t know the growth going forward as it hasn’t happen yet.
- We haven’t allowed for tax in this comparison. If you invest in an ISA in the UK then the tax is irrelevant anyway.
- We have charted this out over 65 years.
- The actively managed fund’s annual fees are 1.61%, which is what Katie and I used to pay!
- We have assumed the fees won’t change over the next 65 years.
The results
Over 65 years, you are 5.2% worse off if you choose Global over Dev World. We have assumed the same growth between the two funds so Global will always come off worse in our assumptions because it has higher fees.
In practice, the growth will be different between the two funds but we can’t know which one will be higher. There is a chance that Global will outperform and make up this difference. There is also a chance Dev World will perform better. We have no idea. No one does!
To put this into context, let’s look at the difference between Dev World and the actively managed fund.
We would be 58% WORSE OFF in the actively managed fund! HOLY MOLY!
The 0.13% difference in fees between the two funds we are comparing makes a difference of 5%, but when you compare this to the actively managed fund fees of 1.61% it makes a MASSIVE DIFFERENCE over time.
What are Katie and I trying to say here? When you get down to the smaller fee numbers it doesn’t make that much difference. It is the massive fees that we need to avoid at all costs. For more about the impact of fees watch this!
Market capitalisation
When Katie and I bought Dev World, Global wasn’t available. One thing we didn’t understand is that Dev World is not an all cap fund!
What the hell does that mean?
Market capitalisation (cap) is the size, in monetary terms, of a business. You take the total number of shares in a company and then multiply it by the cost of each share. This gives you the total value of the company.
For example, there are over 3,000,000,000 (billion) shares in Tesla and each one is worth $256.56 (July 2024). Multiplying the number of shares in Tesla by the share price gives a market capitalisation of over $818,000,000,000 (July 2024).
Some funds, like Global, are all cap index funds, which means they include all sizes of companies. What Katie and I didn’t realise when we bought Dev World was that it is only medium and large cap companies. So they have removed all the small cap companies from the fund.
Katie got super geeky again and produced a series of waterfall graphs to help you see how you can go between Global and Dev World.
You can either choose to view the difference between the two funds by “Number of companies” or by “Weight of company”. Switch between the two using the drop down menu on the chart.
Looking at “Number of companies” makes the difference between the two funds look huge! By number of companies the difference is huge, but it isn’t by weighting.
You start at the left of the chart showing the Global benchmark then as you move to the right you can see what is removed from the index to get to Dev World.
The “Weight of company” shows the difference between the two funds by weighting of the companies (size of the company in $). The figures on the chart are percentages and you can see in this view the difference between the funds is only 22% (since the Dev World makes up 78% of the Global fund).

To help make this a little bit clearer, the orange bar on the left is the benchmark for Global. You then remove 10%, which is the emerging markets. Then you remove 4% for the UK, and finally small cap companies (this is the bit Katie and I didn’t know when we first invested in this fund), which leaves you with Dev World.
We have spent a huge amount of time making the comparison between these two funds as simple as possible for you. I would love to know your thoughts, questions, and comments. Was there anything that confused you? Please help us to make the article stronger by leaving us a comment.
Global vs developed world: the conclusion
The short answer to which fund to invest in is that it doesn’t really matter. As long as you are investing and putting your money into a low cost, broad-based index fund you will be making progress. Just get started.
It’s not binary
As Katie often randomly outbursts, “It’s not binary!” Normally she would add a swear word as well. What this means is that you don’t have to pick one. You could go 50/50 or 70/30 or another split. You could get the developed world and add an emerging market fund to it. This is not a binary decision.
Costs
There is a cost difference between the two funds (0.13%) but it is very small. We have looked in depth at the difference between the funds and you are going to have to convince yourself whether or not you are willing to pay that small amount extra for the global fund.
Global costs more because of the increased administration of owning all those extra companies around the world.
The difference
The companies in Dev World make up 78% of Global anyway! The real difference is you get a bit more diversification and the inclusion of emerging markets in your fund. That is it. Diversification is important.
Donegan plan
What are we going to do based on this? We are going to hold Dev World for now. We are not going to sell and swap to Global. This exercise has shown me that the only real difference for me is the inclusion of the emerging markets in Global. So, if I want to increase my exposure to emerging markets then I will invest some additional money in this fund in the future.
We added £20k into the emerging markets fund and as of Feb 2022 Alan also started to add some of Global into our mix as well.
Just start
In our opinion (and remember this is not financial advise, just our opinion!), both of these funds represent a fabulous way to invest. Both give you an incredibly diversified portfolio of companies around the globe at a low cost. It doesn’t really matter which you pick as long as you get choose one and get started. The way you truly miss out is by not investing in your future and financial freedom.
Pick a fund. Make peace with your decision. Keep on working towards your financial freedom.
The full Investor Series is:
- What is diversification?
- What is an index fund?
- Which index fund should I invest in?
- Decoding the Vanguard website
- The impact of fees on investments
- The battle of the titans: Vanguard Developed world ex UK versus Vanguard FTSE Global All Cap
- Just start. Get in the game!
Disclaimer: This is not financial advice. Katie and I are not trained financial advisors, nor to we pretend to be online. Read our full disclaimer here.
I note that the Vanguard FTSE Developed World ex-U.K. Equity Index Fund GBP Acc is dominated by companies in the technology sector (Microsoft, Apple, NVIDIA, Amazon, Meta) and heavily weighted towards North American stocks. If those 5 companies do badly, will it not pull down the entire fund? Although the fund is diversified across many different countries and sectors, it is nevertheless quite strongly biased towards North America and technology. Is that not a potential risk? Nothing in this life is permanent. These 5 companies cannot continue growing forever.
Hey Andrew, super point and you are right. It is heavily focused on those companies and the North American market. You want this as at the moment those are the most profitable and valuable companies and sectors in the world. So right now this is where you want your money.
You are also right that nothing is permanent and that is why we love index funds so much as the fund will auto rebalance as the market shifts. For example in 2012 the UK was nearly 11% of the Global All Cap and that has reduced to 4% as the UK has under performed for years. You don’t want your money in the UK right now and the fund auto rebalances for you.
So in the fund you mentioned if Tech does worse in future years it will downsize in the fund and whatever does better will take over and grow instead. This happens over the decades with natural Resources being the biggest chunk in the 80s, changing to banking and finance ain the 90s and then tech in the 2001 bubble and then changing again. The fund changes with the market and you don’t need to do anything.
We want the fund to reflect what is doing well at the moment and then we want it to change as that changes. What we love most about index funds is they re self cleansing and auto-rebalancing! Does that make any kind of sense? Did that help? Feel free to reply. Alan and Katie
Can you please explain the ‘transaction fees’ (not platform or trading fees) which Vanguard list on their website. I’m expecting to pay the provider (iWeb in this case) annual fee plus their (£5) trading fee, plus the 0.23% ongoing fund charge, but I don’t understand the 0.09% transaction charge which is also mentioned on the Vanguard website. Thanks.
Hey Stuart. Thanks for messaging. You know about platform and then fund fees. Platform gives you the accounts and all that jazz. Fund fee is for managing the fund and then in all funds there are transaction fees which depend on how many trades the fund has to do to stay close to the index. Vanguard is one of the only platforms that actually tells you about it, most of it is hidden from us in other funds but still happens. We pay this as well (our account is with Halifax and then we have Vanguard Funds in it) and it varies each year. It is super annoying but part of life unfortunately.
Hi. I plan to take out one of the Vanguard index funds. My questions – 1) should I take it out directly with Vanguard or via another platform? 2) as a tax paying working adult in the UK (42% tax bracket), am I best to take as an ISA? Thank you!
Hey Hazel, My Mum’s name is Hazel. Are you my mum? Just checking:
If you are a higher rate tax payer SIPP has amazing tax benefits. Have you done Week 8 of the course? Will you be able to retire before you are 210 years before your state pension age? If not then SIPP will be the best I believe. We aren’t financial advisors though and I don’t know enough about your tax situation to truly know.
The Vanguard Platform is great. We did a platform review recently if you want to read it for more details: https://rebeldonegans.com/blog/uk-investment-platform-review-2025/
Does that help?
Alan
What an in depth and educative article.
Bravo Donnegans!
Please carry on the good work..
Thanks Simi! we had so much fun learning as we produced this one and studied! THANK YOU for commenting! Alan
I’ve loved your course, huge thanks for sharing all your knowledge – wish I’d understood all this decades ago! One question, I am confused! Having set up a Vanguard account and looking to transfer an ISA. I’ve chosen the Vanguard FTSE Global All Cap Index Fund Accumulation from their drop down menu but on reading the costs, it states there’s a monthly management fee of 0.29% on top of the 0.23%. I thought it was a passive fund, not managed or has it changed? I can’t see anything else in the drop down that is Global All Cap Index etc so I’m a bit puzzled. Have I chosen the wrong fund?
Hey Julie, how much are you putting into the fund? Below £32k it will feel a little bit more expensive as a percentage because of their £4 a month minimum. Does that make sense? After £32k it is a straight percentage capped at £375 a year but there is a lower limit as well, £4 a month which makes it more expensive as a percentage when you are first starting out. Let me know if I explained it ok. Alan
Yes it’s below 32k as I’m transferring a cash ISA that matured in October and then I’ll add more for this financial year which will take it over 32k. So I think you’re saying it drops back to just 23% after 32k? Keep up this great work you pair, it’s life changing for those of us who have never understood pensions and investments! Hoorah and thank you!
Julie, what a lovely post. That is great to know. Above 32k it is a simple 0.15% platform fee capped at £375 a year. Then you will have a fund fee (same as any platform) which is based on which fund you choose. The FTSE Global All Cap is 0.23 or the Vanguard FTSE Dev World ex UK is 0.14%.
And thank you for saying. Your comment made my day and we will keep on going working to explain this stuff. Sending happiness. Alan
Hi Donegans
Thank you for this article – I’ve just finished Week 8 of your course and was all fired up to set-up my Vanguard SIPP account to invest in the FTSE Global All-Cap but then reviewing my options with my existing pension (an old workplace pension with L&G) they have an Index Fund I can transfer to (L&G PMC World (ex UK)
Equity Index Fund 3) with is not as diversified but the fees are lower! The fees are only 0.18% (0.12% fund management charge + 0.06% annual management charge) so I feel like I shouldn’t simply go straight to investing in the FTSE Global All-Cap without further research of the L&G index fund (taking note of your ‘Fees – the silent killer’ article Katie’s fab tool says I would be 109k better off staying with L&G! But will the fund perform as well!
The L&G fund is passive (tick), 100% equities (tick) global but excluding UK and is only developed markets (half a tick?!). So a bit like your comparison in this article of the 2 Vanguard funds I’m trying to balance it all out but struggling to research a conclusion! Do you have any advice on this lower fee versus more diversification dilemma? Thank you in advance if you are able to respond :)
hey Cassie that is the whole dilemma between the FTSE Dev world and the Global All cap summed up in your message. There is no right answer. Both are good options. 0.18% total fees for your L&G pension are amazingly low which is fabulous. I would be tempted to stick with that as the fees are low and and the fund is pretty dam good. You would increase fees by moving out. If it was me I would probably enjoy the lower fees and then monitor and revist my decision in my annual finance meeting. I would write down my current thinking and ask future me to check my thinking once a year… Does that make sense? Does that help? Alan
Thanks Alan – really appreciate your view on this and thanks again for creating this course!
Hi, what if i want to use Trading212 to buy the same fund? Is that also same?
T212 is a great platform for ISAs. They have a free ISA but they don’t have a SIPP yet.. it is apparently coming later this year. It depends on the account you are wanting. Do you want Sipp or ISA? Alan